How to Improve UX (User Experience) Using Microsoft Clarity, Completely Free
Introducing methods to enhance user experience (UX) using Microsoft Clarity. Will explain specific techniques that are beneficial for UX design and content strategy.
2024-04-250 minute readWeb
Share
Optimizing Website UX with Microsoft Clarity
Microsoft Clarity is a user behavior analytics tool provided by Microsoft to enhance website performance and user experience. Specifically, Microsoft Clarity offers the following features:
Heatmaps: Microsoft Clarity offers a heatmap feature that visually displays user interactions such as clicks, scrolls, and mouse movements on web pages. This helps identify which areas attract user attention and how users navigate through the page.
Session Playback: You can record and replay user sessions with Microsoft Clarity. This allows you to observe how users interact with your site in real-time, helping you identify issues and points for improvement.
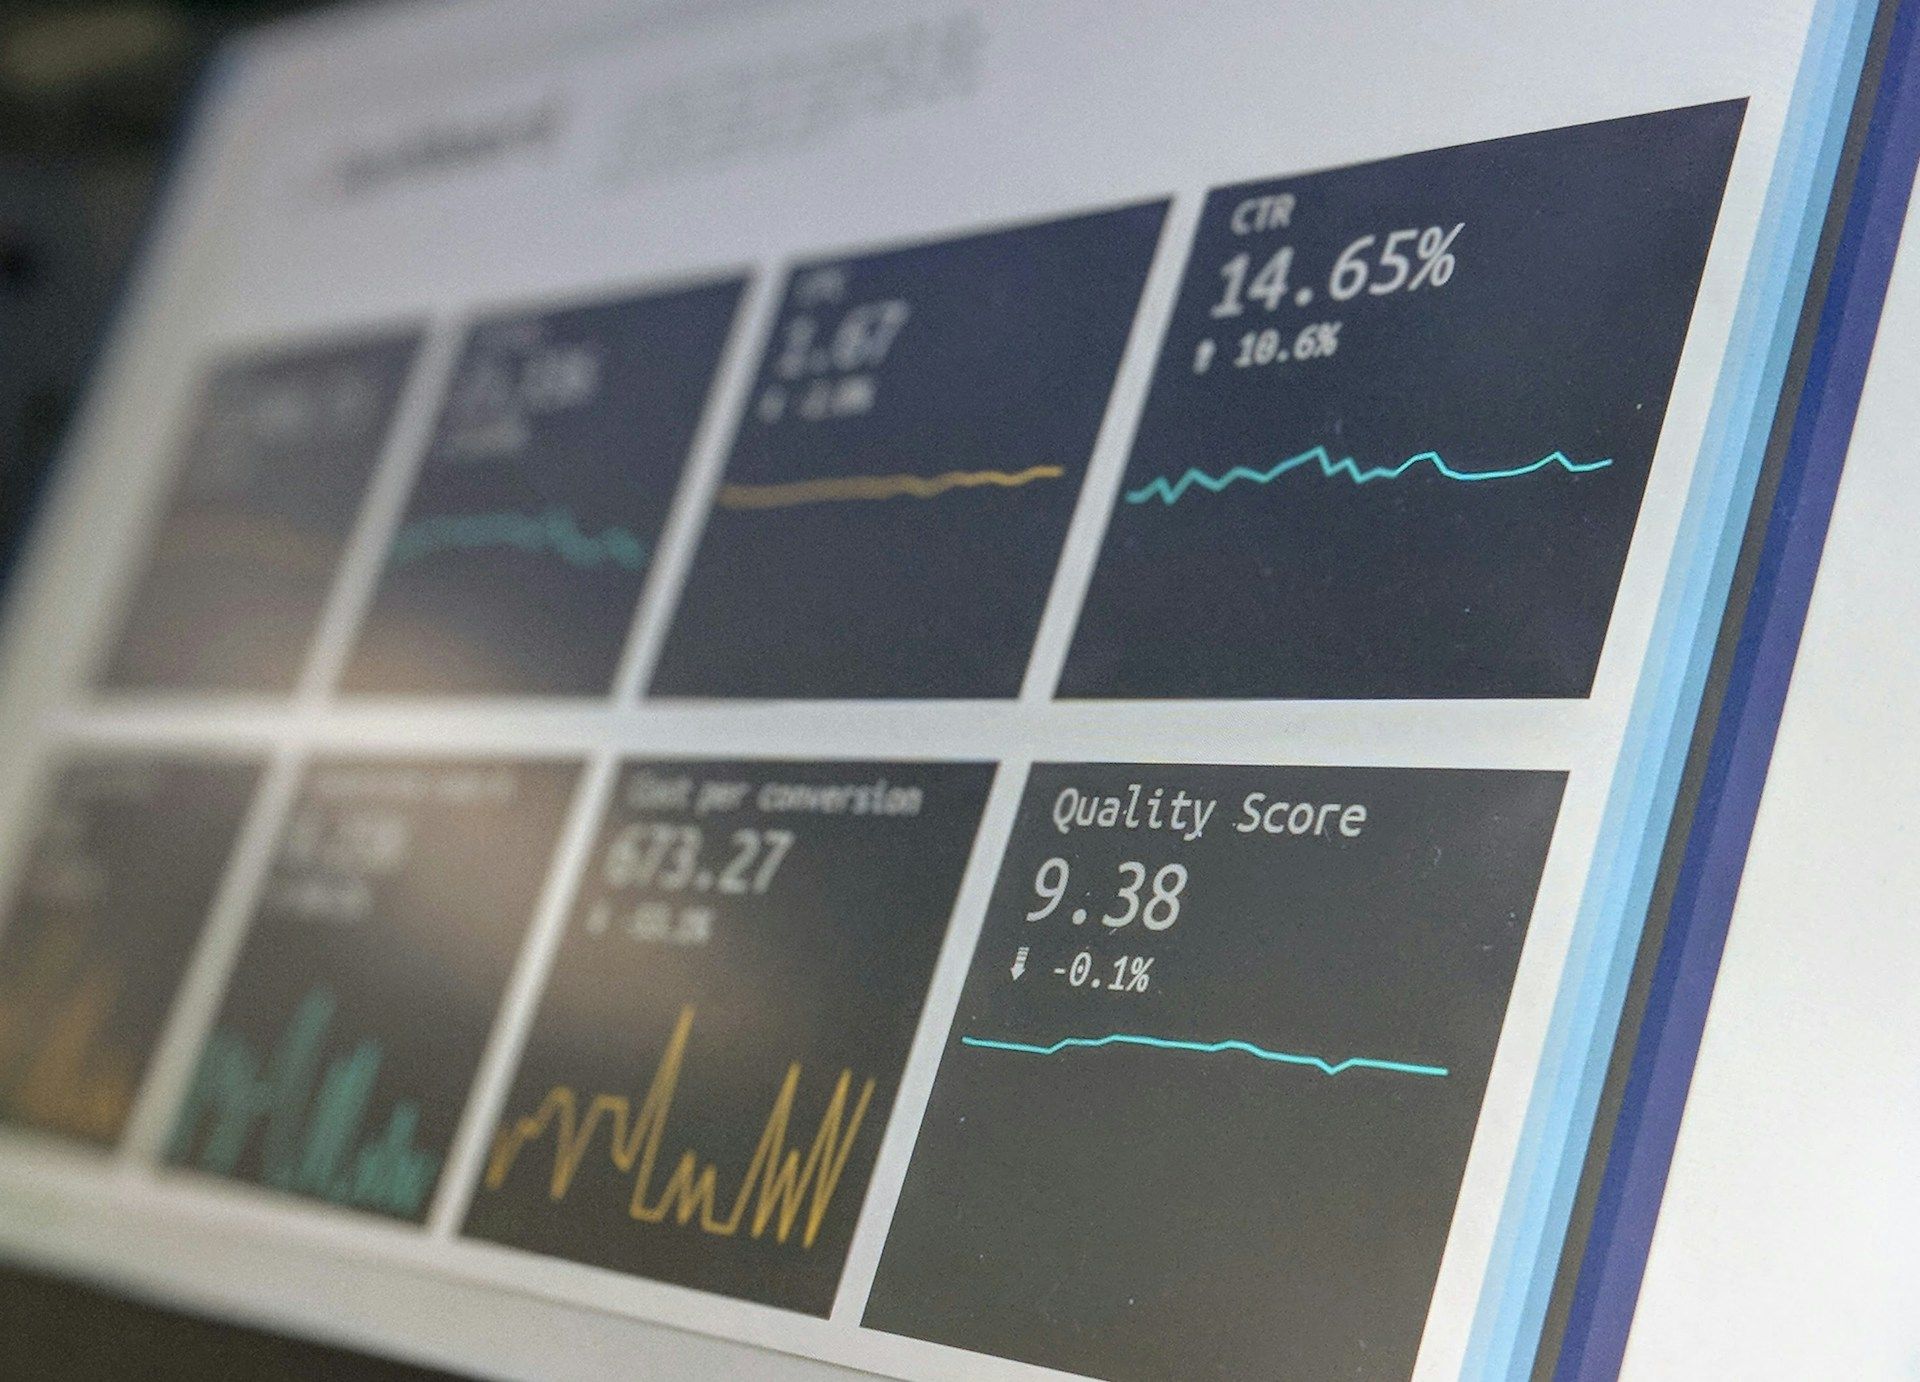
Reporting and Analysis: Real-time data collection on clicks and scrolls enables the generation of insightful analysis reports. Through these reports, you can gain insights into areas for page improvement and effective design changes. Additionally, the analysis reports provide data such as user browser information and referral sources, making it a compatible tool with Google Analytics.
Microsoft Clarity is a valuable tool for web developers and digital marketers to enhance and optimize websites. Typically, services offering heatmap analysis for websites can be costly and have high implementation barriers. However, Clarity is entirely free to use and features straightforward implementation.
All data is processed in real-time. Unlike Google Analytics (GA4), which may have up to a 72-hour delay in data reflection depending on the plan, Clarity offers more real-time analytics, making it effective for those seeking immediate insights. Furthermore, its integration with Google Analytics allows for comprehensive analytics.
In this article, we will introduce data analysis techniques using Microsoft Clarity.
Implementing Clarity
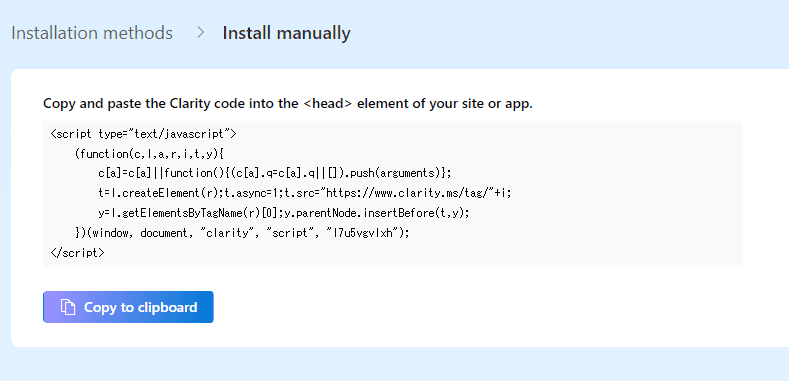
Implementing Microsoft Clarity is incredibly straightforward. Simply insert the JavaScript tag issued from the Clarity management interface into your website.
The code does not pollute global variables, ensuring seamless analysis of website access regardless of the underlying framework used.
Once the code is integrated, data collection begins immediately. Let's explore the features starting with the dashboard.
Dashboard
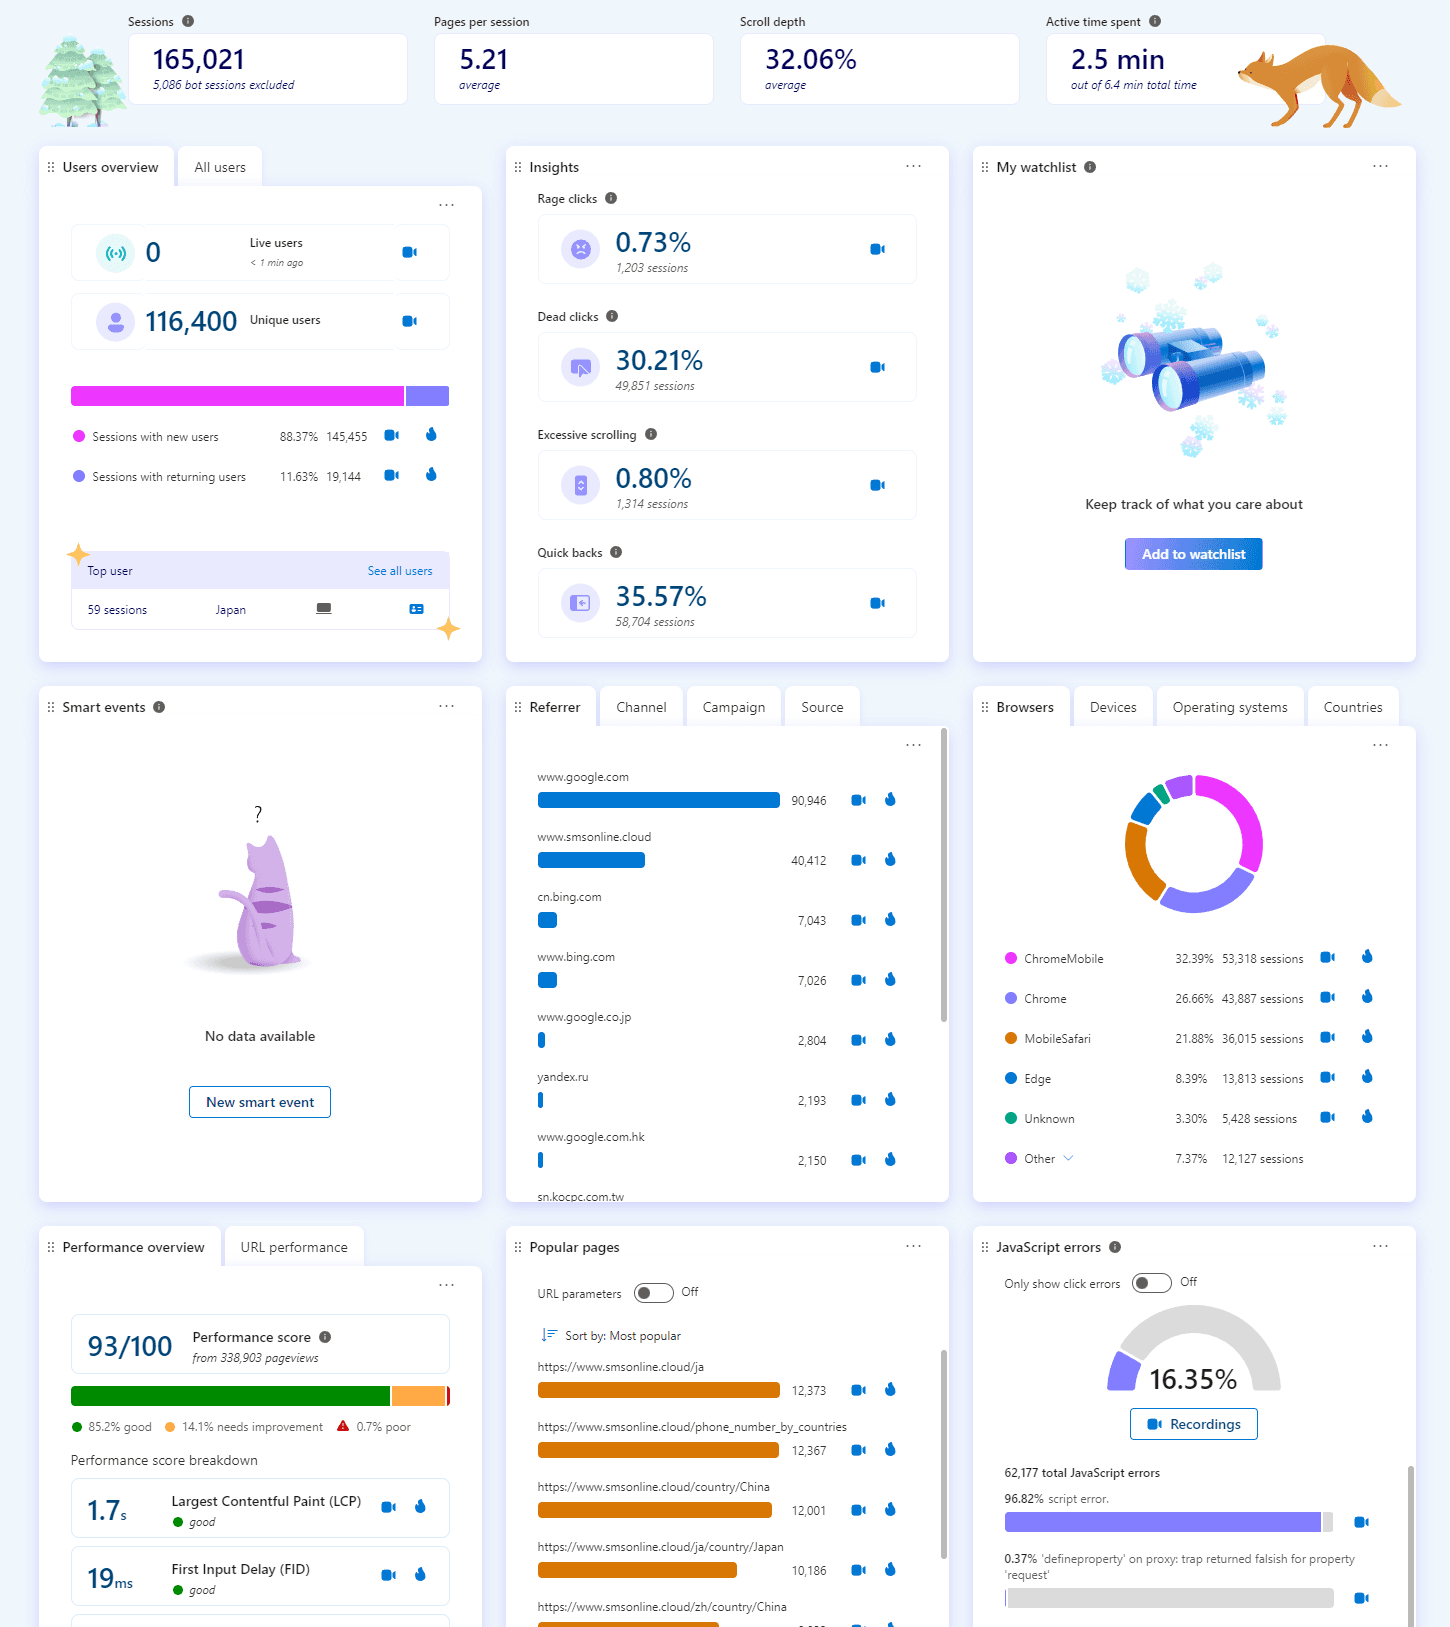
In the dashboard, essential information for user behavior analysis is organized on a grid, allowing for comprehensive review. Let's explore the roles of each grid component:
- Users Overview: Displays real-time and unique user counts visiting the website during a specific period.
- Insights: Analyzes user emotions based on actions (e.g., clicks, scrolls) on the website. For example, continuous clicking might suggest user frustration, indicating potential issues like "Interaction to Next Paint."
- My Watchlist: Clarity allows saving filters as segments, and the Watchlist lets you review information for specific segments.
- Smart Events: Automatically tags notable events and provides analysis for each event using AI.
- Referrer/Channel/Campaign/Source: Shows the origin of user visits to the website, including websites, channels, and campaigns. Users can be filtered based on each pathway to review screen recordings and heatmaps.
- Browsers/Devices/Operating Systems/Countries: Analyzes device information of website visitors. Users can be filtered based on these conditions to review screen recordings and heatmaps.
- Performance Overview: Collects and analyzes information on Core Web Vitals like LCP, FID, CLS. By filtering user data related to scores, this supports a more direct approach to problem-solving.
- Popular Pages: Lists popular URIs on the website.
- JavaScript Errors: Displays JavaScript errors observed on the website.
Now, let's delve into Clarity's unique feature:
Screen Recordings
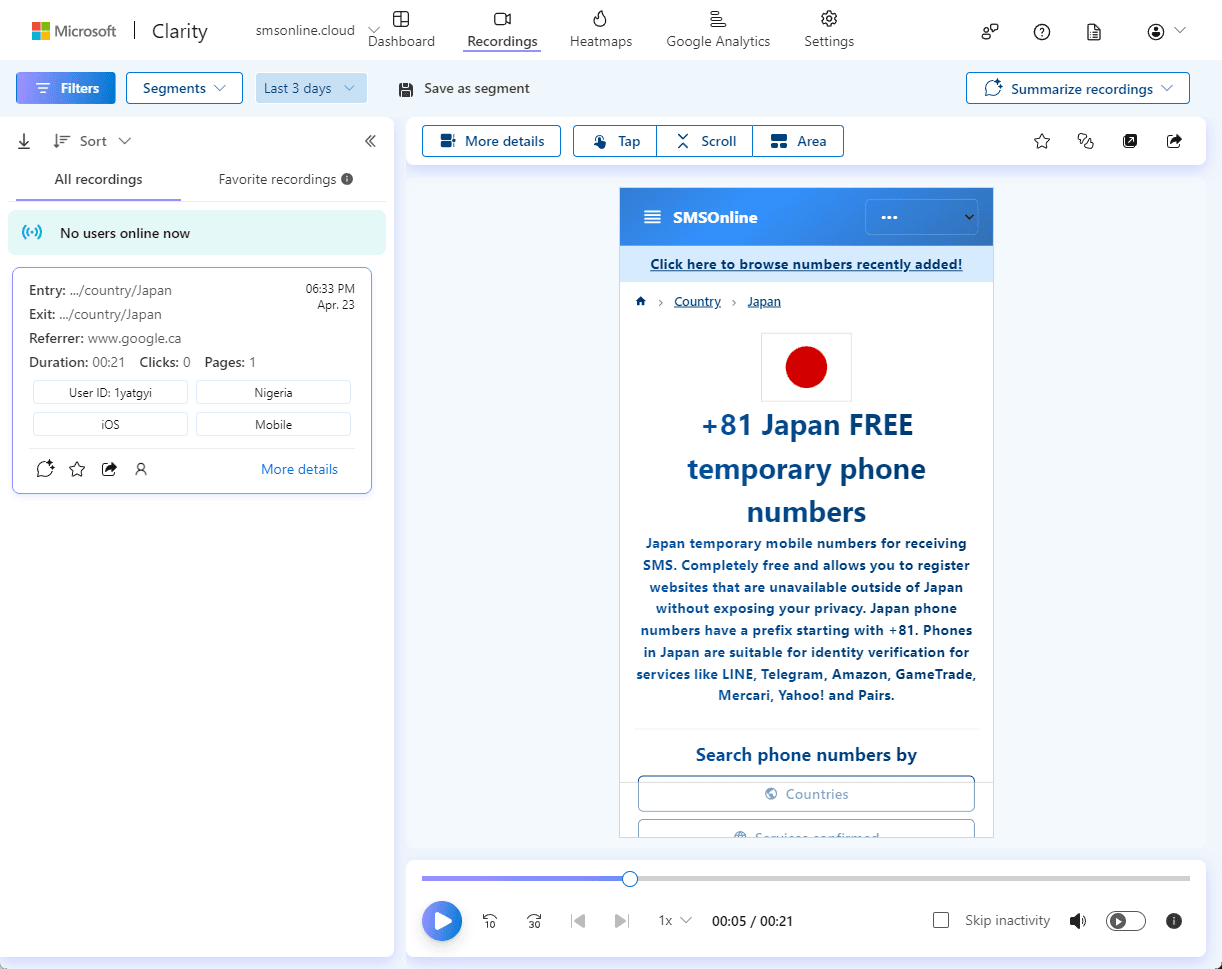
With Clarity, you can view real-time screen data of users accessing your website. This means you can observe how users scroll, where they click, and where they linger on web pages, providing insights for optimal ad placement and more.
It's important to note that all data entered into text boxes is automatically masked within Clarity. However, to respect user privacy, Microsoft recommends explicitly mentioning the use of Clarity in your privacy policy as follows:
"We partner with Microsoft Clarity and Microsoft Advertising to capture how you use and interact with our website through behavioral metrics, heatmaps, and session replay to improve and market our products/services. Website usage data is captured using first and third-party cookies and other tracking technologies to determine the popularity of products/services and online activity. Additionally, we use this information for site optimization, fraud/security purposes, and advertising. For more information about how Microsoft collects and uses your data, visit the Microsoft Privacy Statement."
Heatmaps
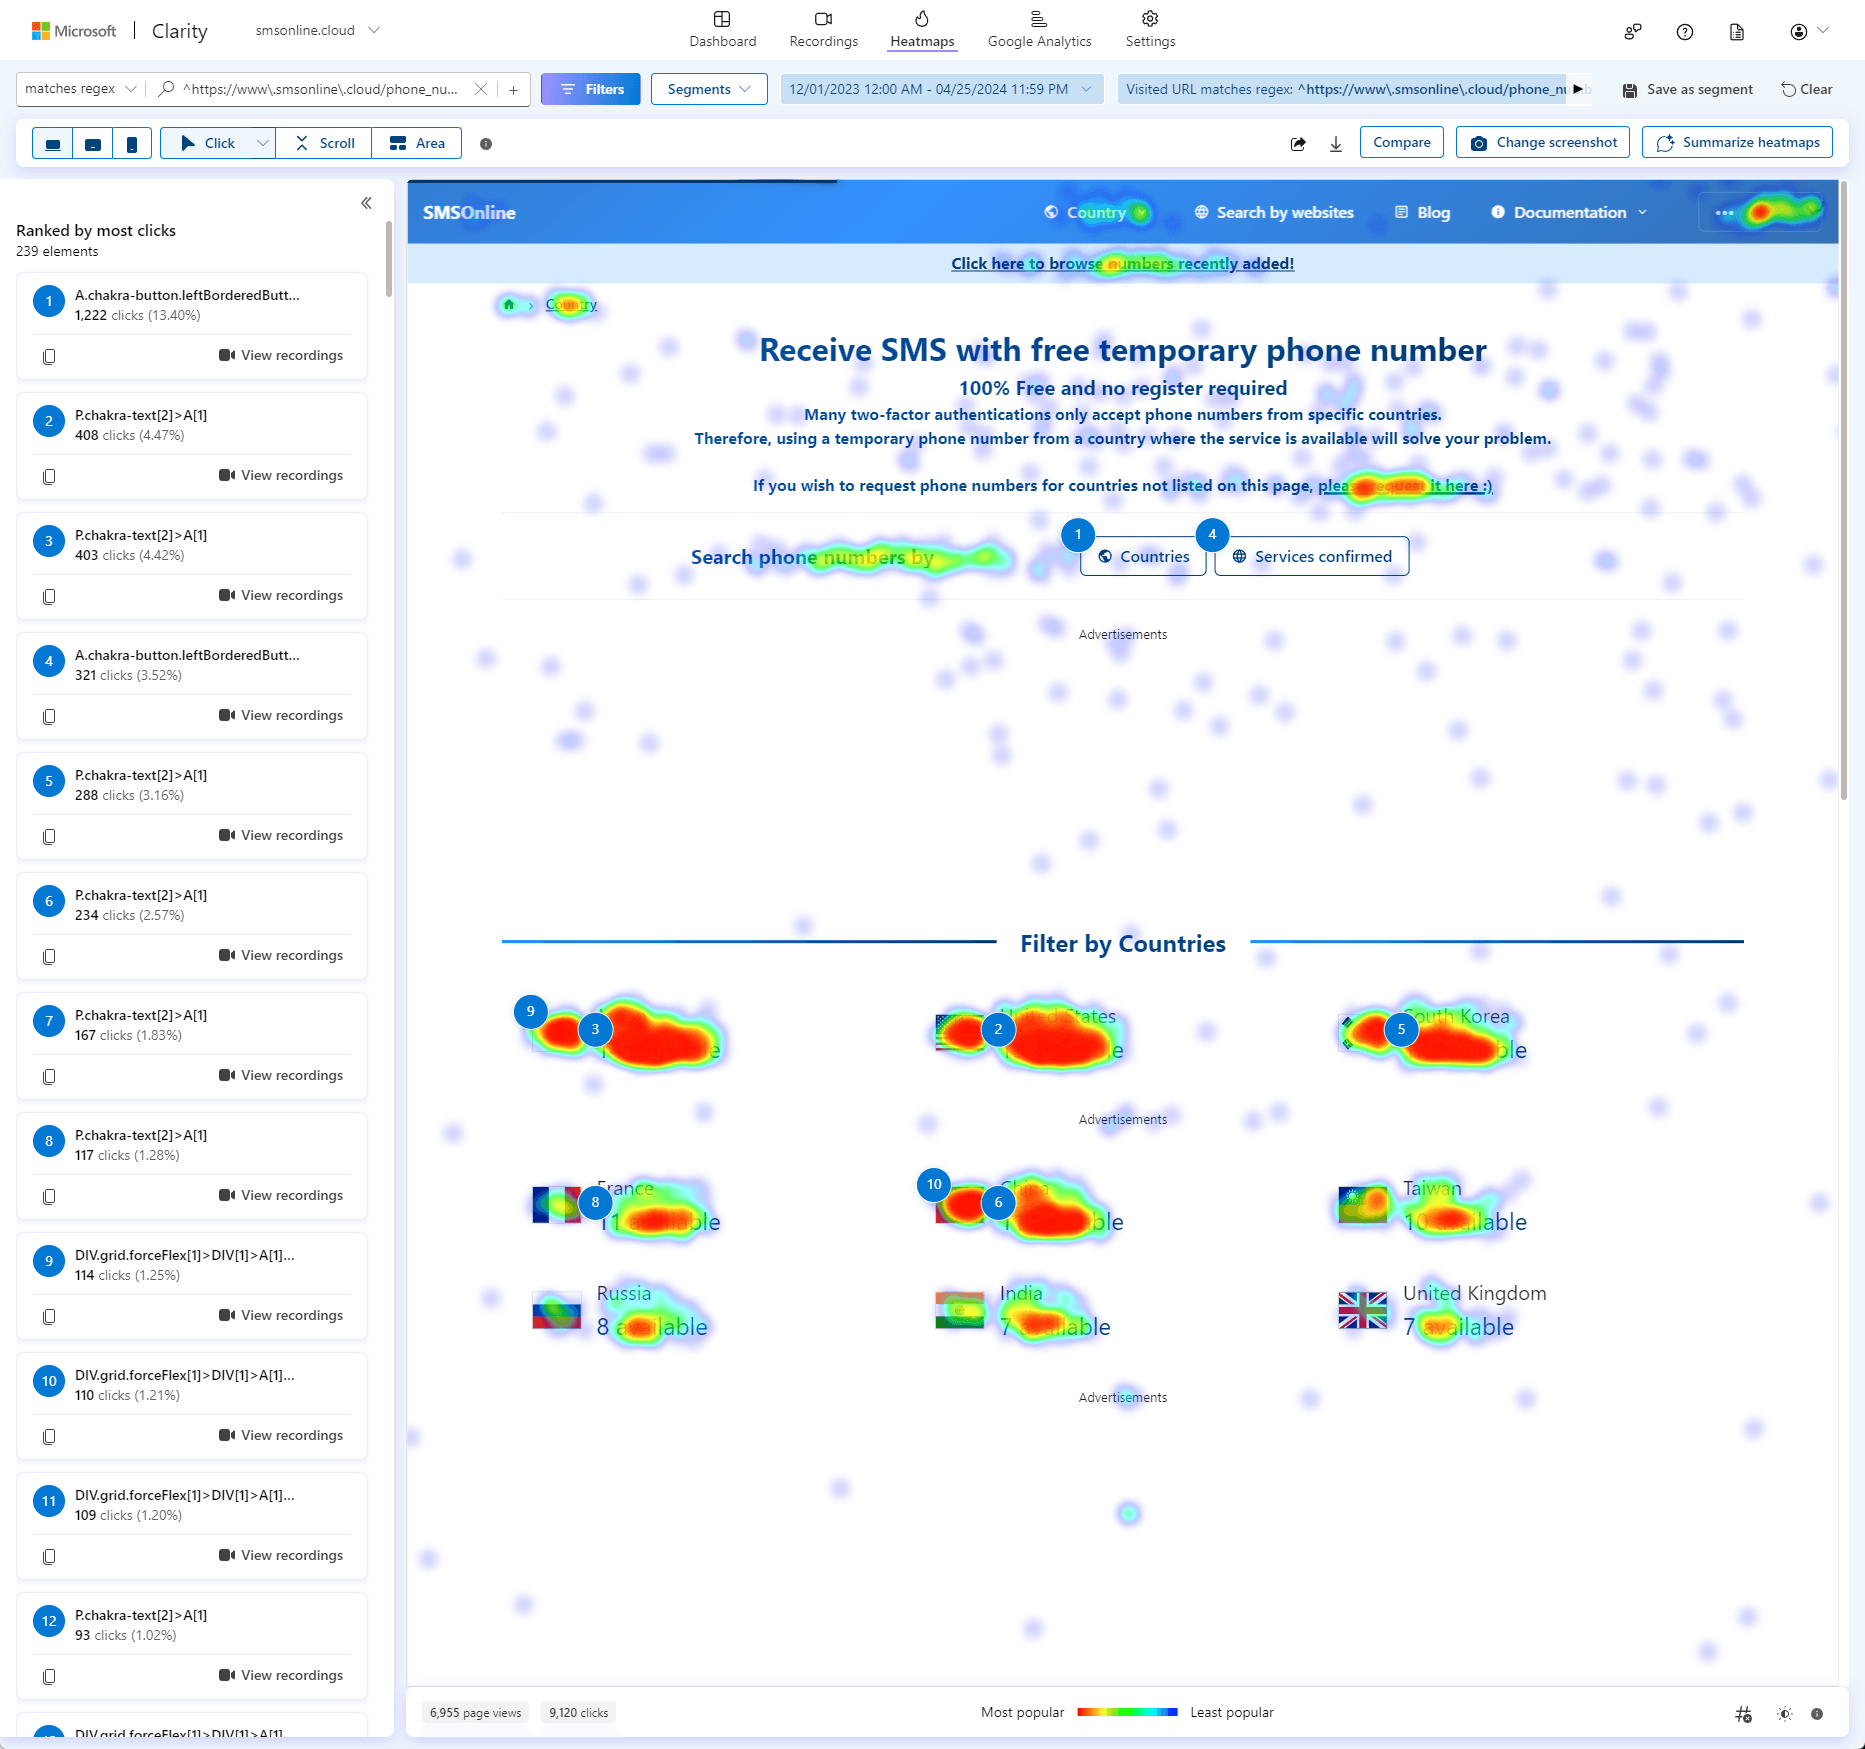
Heatmaps are one of the more aggregated features and my personal favorite :)
For a defined set of users meeting specific criteria (such as Website URI or access environment), a heatmap displays which areas on the website are most clicked. Additionally, you can review recordings to understand the process behind each click event.
Effective uses of this feature include:
Optimizing Page Design: Use heatmaps to understand where users' attention is focused and optimize page design and layout accordingly. For example, if certain content or CTA buttons are being overlooked, highlighting or repositioning these elements can improve user engagement.
Improving Content Strategy: Use heatmaps to understand how users consume content. Identify frequently skipped content or areas of high interest to improve content strategy. Adopt more effective headlines or content formats to capture user interest.
Optimizing Forms and Processes: Analyze how forms or multi-step processes are used using heatmaps. Understand where users hesitate or abandon input fields or checkout processes to find areas for improvement. For example, investigating why specific form fields are skipped based on heatmap data can lead to optimizing form design and flow to increase conversion rates.
For instance, areas with the highest number of clicks indicate high engagement, suggesting that placing advertisements around these areas may also result in higher conversion rates.
Comparison with Other Analytics Tools
Google Analytics vs. Microsoft Clarity

Microsoft Clarity and Google Analytics are both web analytics tools but have different characteristics and functionalities. Here are the key differences between Microsoft Clarity and Google Analytics:
- Data Collection:
- Microsoft Clarity: Microsoft Clarity uses session recordings and heatmaps to record actual user behaviors. It collects specific click and scroll data to visualize user actions in real-time.
- Google Analytics: Google Analytics collects aggregated data such as page views, sessions, and user counts to analyze website traffic, user demographics, and behavioral patterns. It primarily focuses on analysis based on aggregated data.
- Focus of Analysis:
- Microsoft Clarity: Microsoft Clarity primarily focuses on user experience and user behavior. It analyzes how users interact with the site and which areas are getting attention in detail.
- Google Analytics: Google Analytics analyzes information related to business goals and marketing strategies, such as website traffic, conversions, traffic sources, and device usage.
- Achievements:
- Microsoft Clarity: Microsoft Clarity is specifically designed as an analysis tool focused on improving user experience and website enhancement. By visualizing specific user behaviors, it helps identify issues and drive improvements.
- Google Analytics: Google Analytics provides extensive business data used for evaluating website performance and marketing campaign effectiveness.
In summary, Microsoft Clarity is specialized in detailed behavioral analysis focusing on improving user experience, while Google Analytics is used widely for collecting and analyzing a wide range of website data to inform strategic decision-making and goal achievement. Therefore, Google Analytics is suitable for customized purposes such as analyzing campaign effectiveness on websites, while Clarity is useful for more generalized and abstract behavioral analysis of users.
Cloudflare Browser Insights vs. Microsoft Clarity
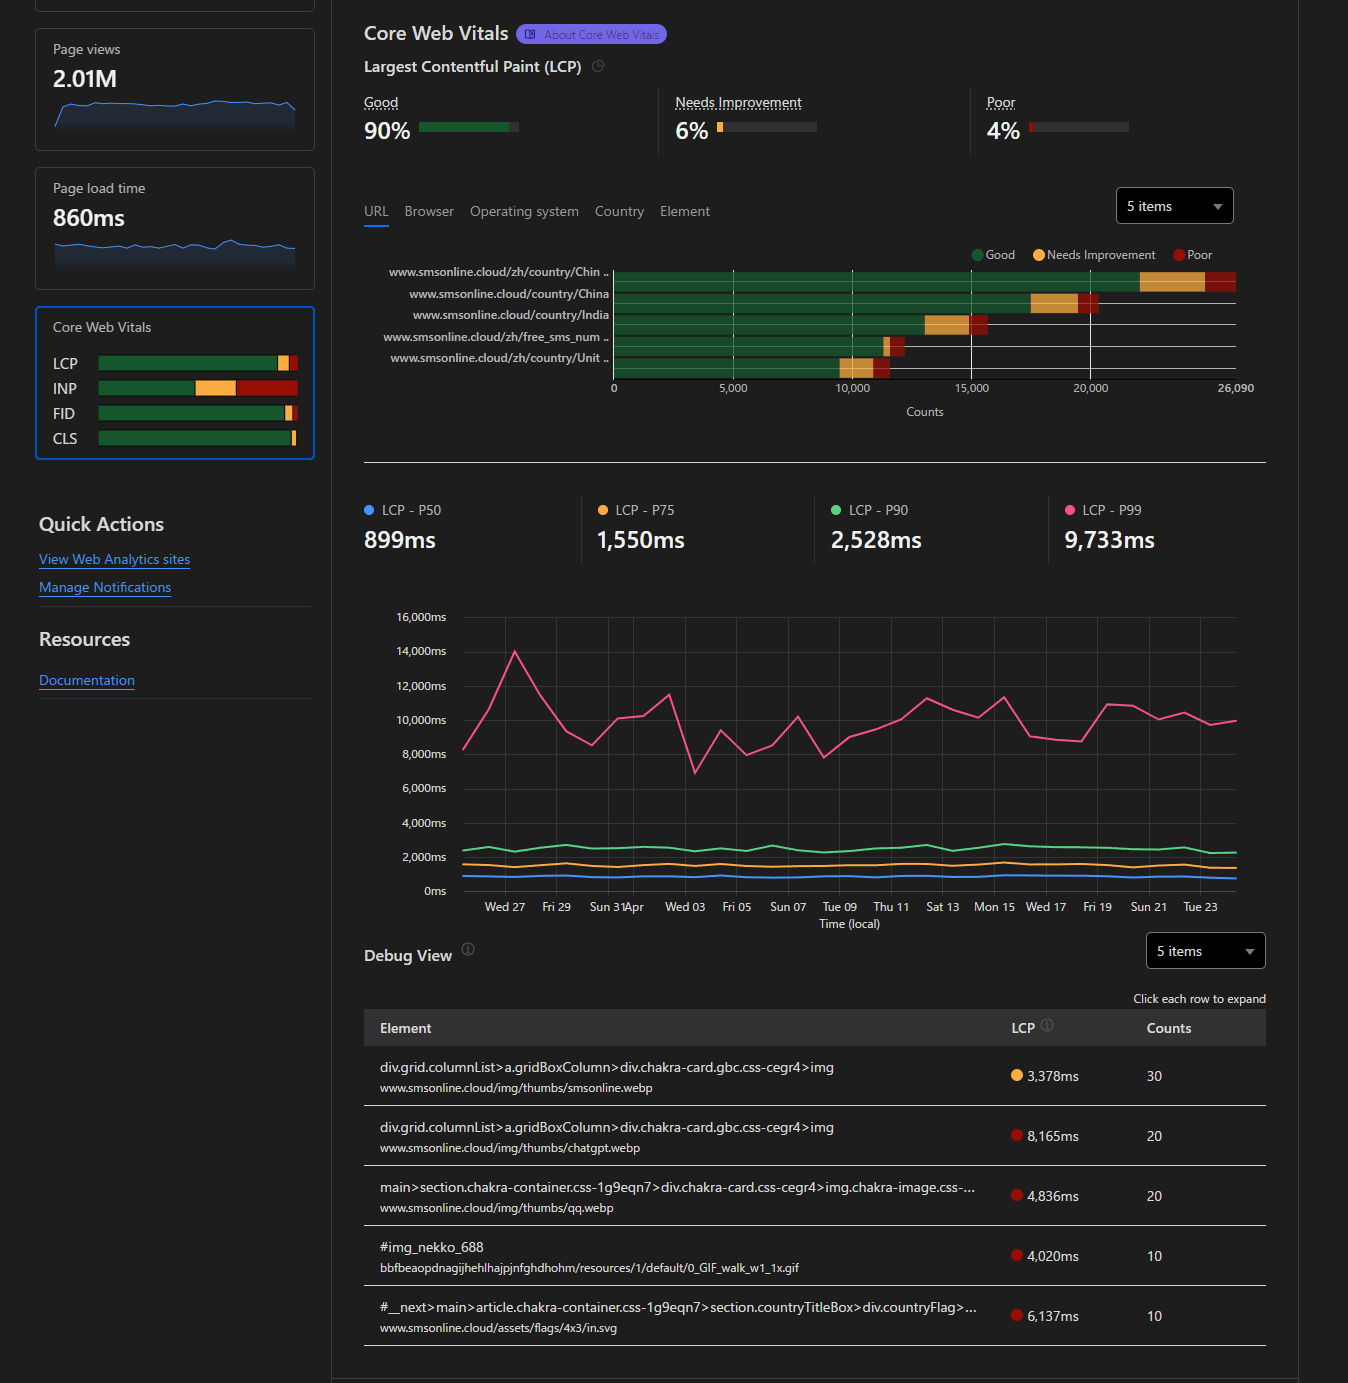
Cloudflare Browser Insights is part of Cloudflare's web performance monitoring tools. This tool collects detailed data on website load times and performance and provides visualization of this data.
Browser Insights offers comparative data on page loads across different browsers (Chrome, Firefox, Safari, etc.), allowing you to identify and address performance issues specific to certain browsers. This is especially crucial for addressing each element of Core Web Vitals.
In summary of the differences between Browser Insights and Clarity:
Cloudflare Browser Insights is a real-time analytics tool specialized in web performance monitoring, with integration features specific to Cloudflare's services.
Microsoft Clarity is a behavioral analytics tool focused on improving user experience by visualizing user behavior data for website enhancement.
Therefore, leveraging both services and integrating their data can lead to achieving higher levels of user experience optimization. Integrating insights from Cloudflare Browser Insights and Microsoft Clarity can provide comprehensive performance and user behavior analysis, leading to more informed decisions for improving website performance and user engagement.
CONCLUSION
Microsoft Clarity is extremely useful for those looking to improve website performance and user experience. By utilizing features such as heatmaps and session recordings, website owners can understand how users behave on their site and identify areas for improvement.
Moreover, leveraging Microsoft Clarity alongside software like Google Analytics and Cloudflare Browser Insights can create synergies in optimizing website performance and user engagement.
It's important to note that tools like Google Analytics, Microsoft Clarity, and Cloudflare Browser Insights are all asynchronous and do not significantly impact page load speed. If you are concerned about how these tools might affect your website's speed, consider using software such as Cloudflare Zaraz or Partytown to minimize these impacts.
Since these tools are all free to use, we recommend starting by implementing them and measuring their effectiveness in improving your website's performance and user experience.